01
Show the numbers that matter.
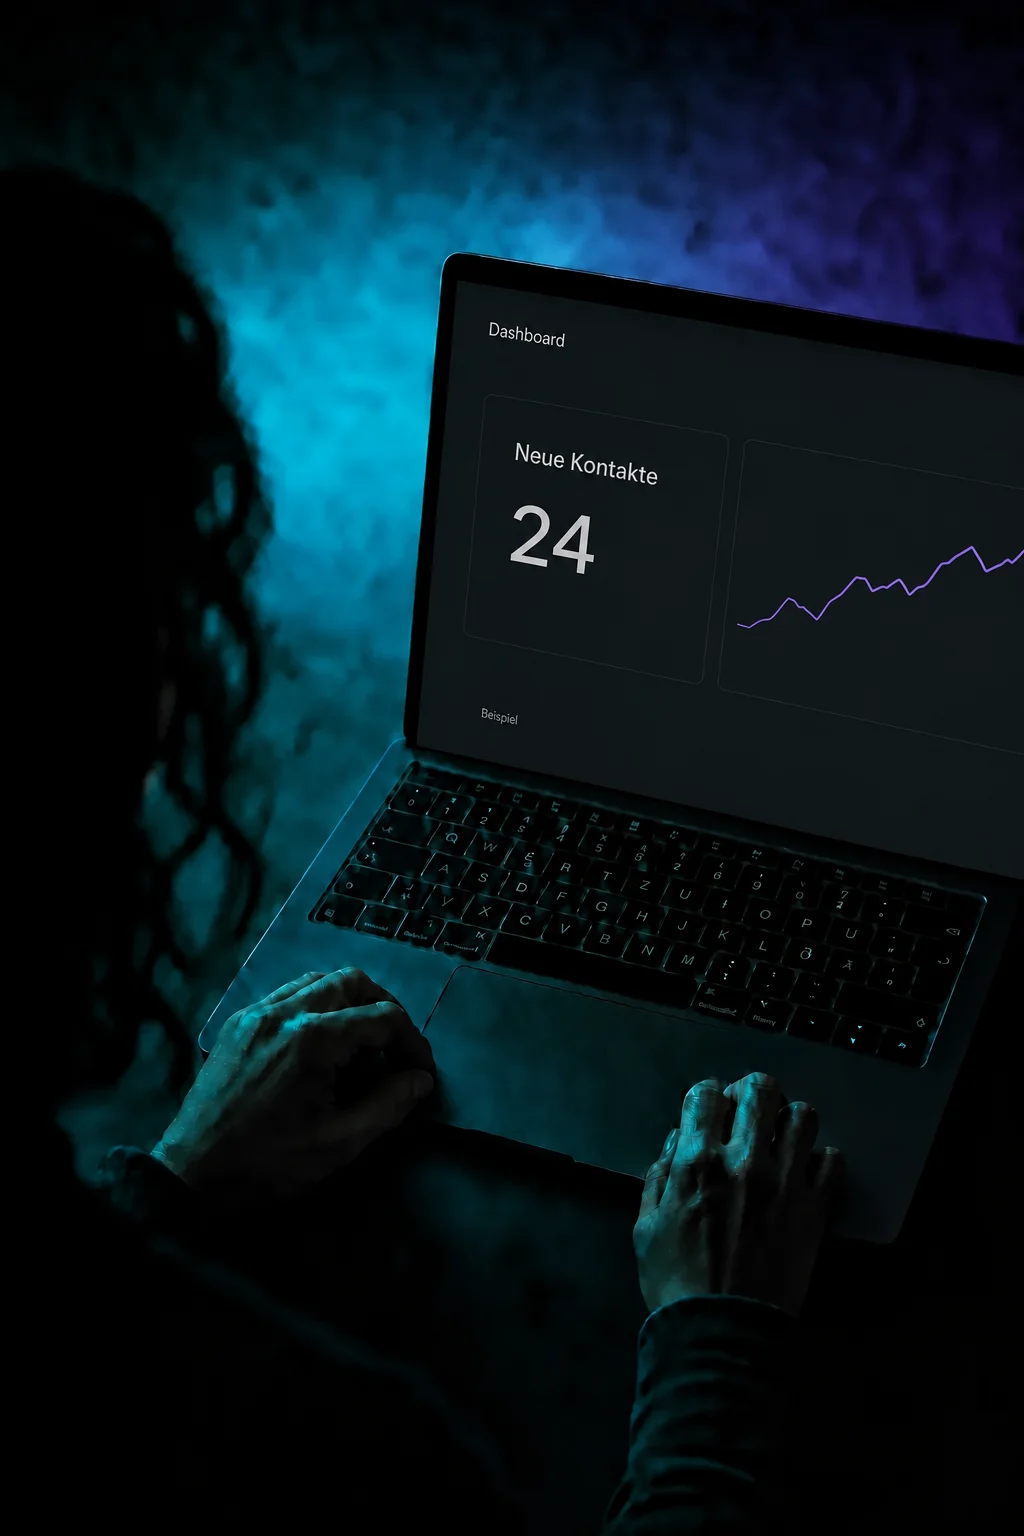
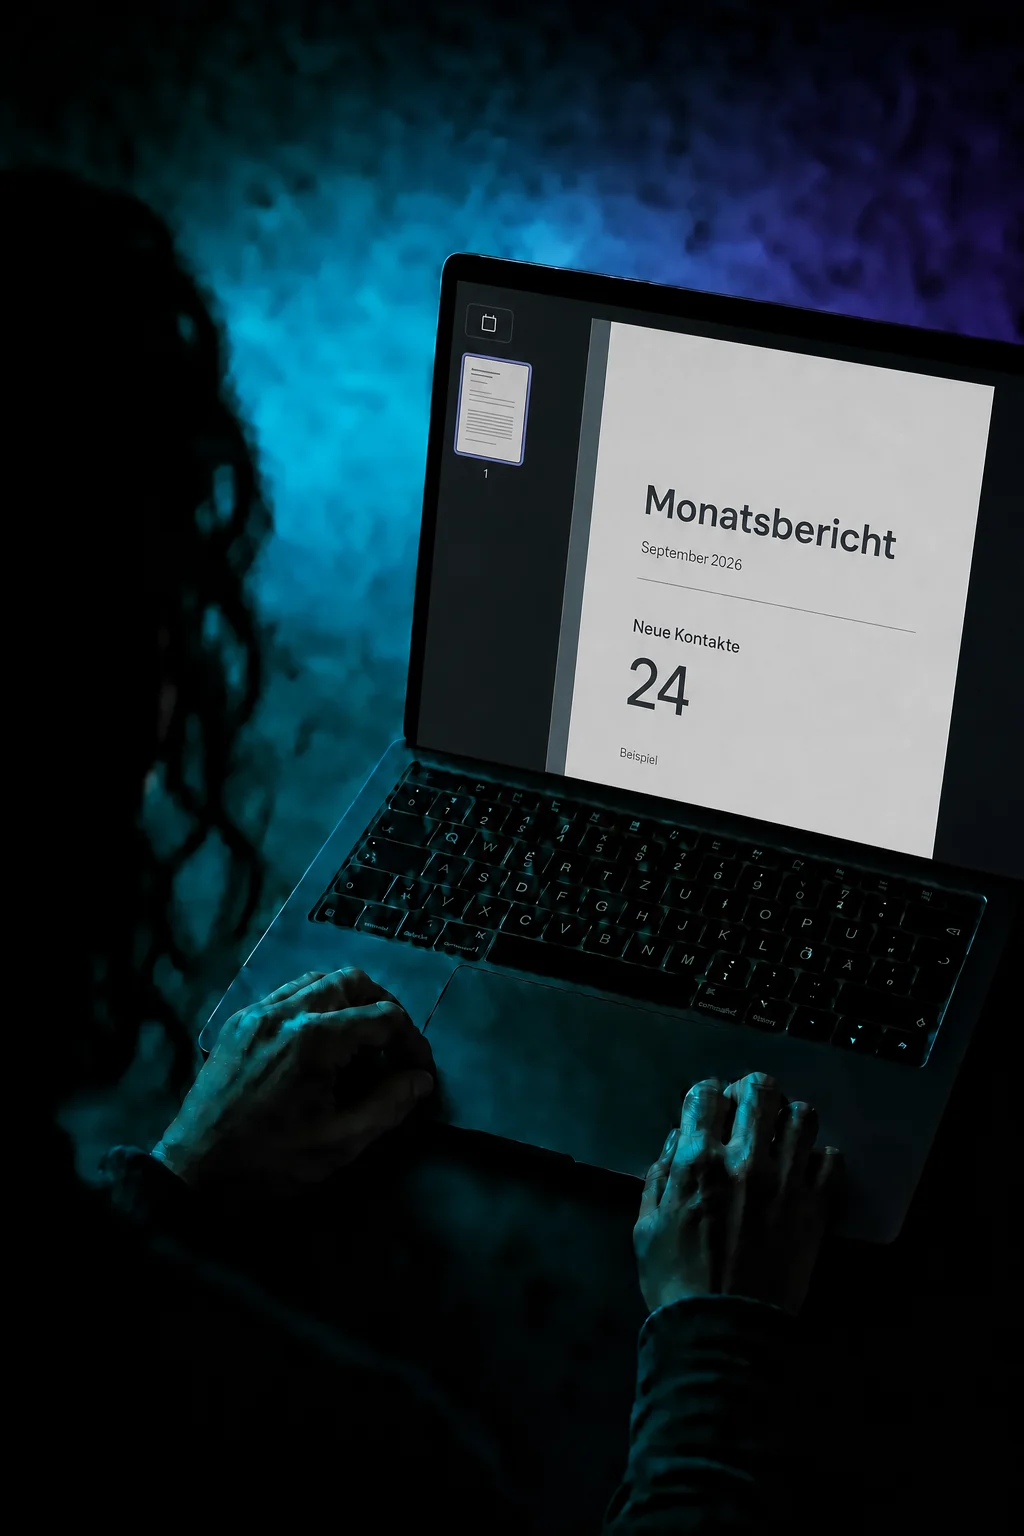
Choose metrics and arrange them on the report pages. This example shows new contacts in a monthly report. Its title and period make the number easy to place.

Reports
Build a report for your team or clients. Check it with a test email, then schedule regular delivery.
Three examples show how you can use Reports.
Choose metrics and arrange them on the report pages. This example shows new contacts in a monthly report. Its title and period make the number easy to place.
Send yourself a test email first. Check the layout and figures before sharing the report with your team or clients.

Choose recipients, time and frequency, such as monthly. Select the data period separately, for example the previous month. Save the schedule to enable recurring delivery.

The practical benefits of Reports.
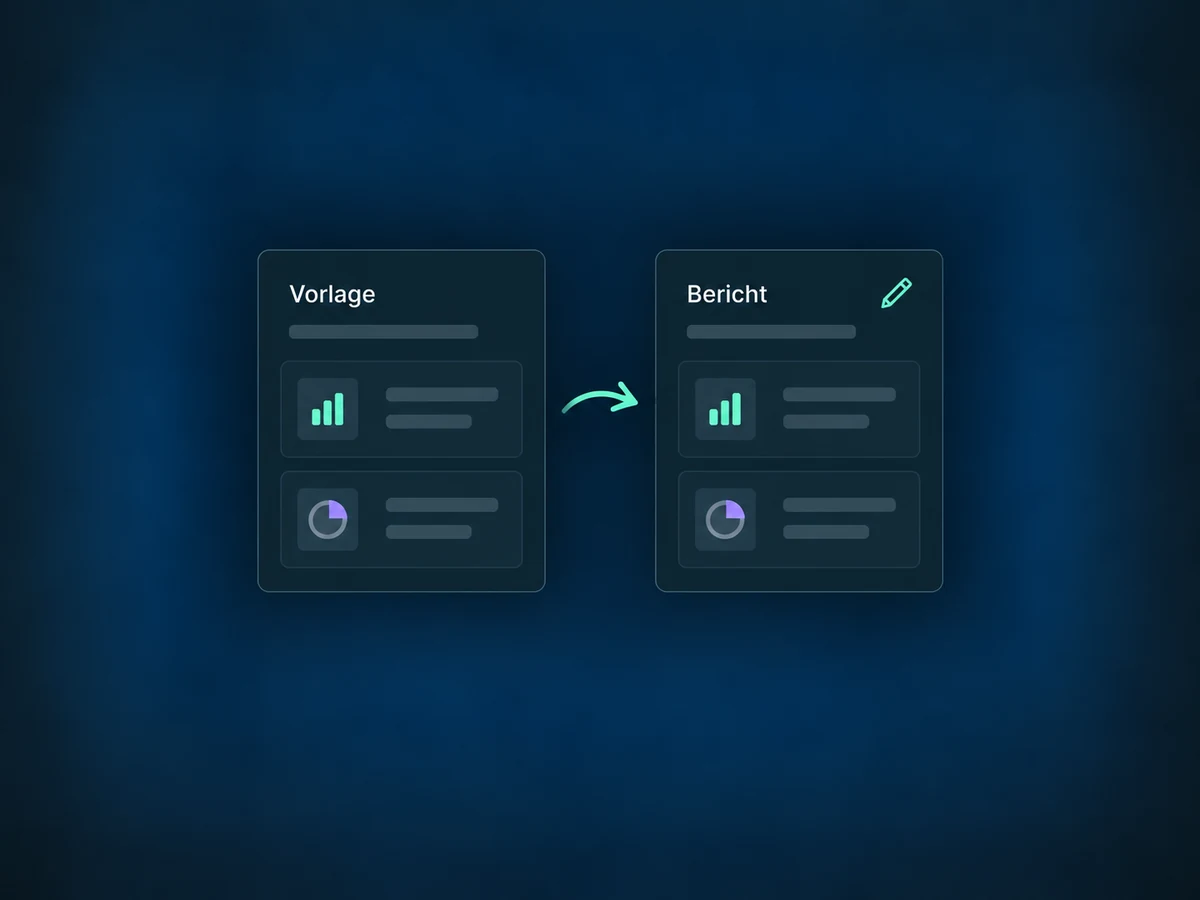
Choose an available report template and adapt it. Later template changes do not alter reports you have already created.
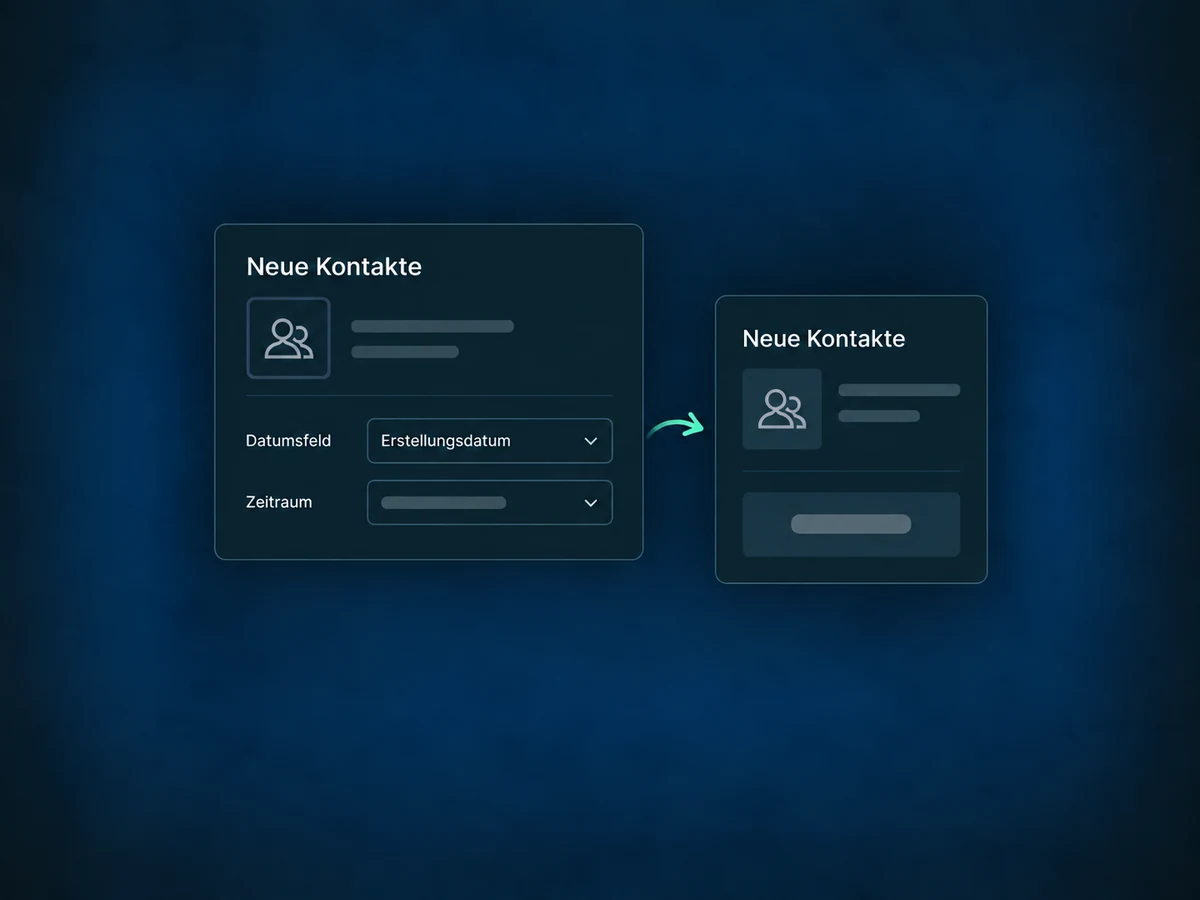
Summarise new contacts by creation date. A contact count measures records, not necessarily qualified enquiries.
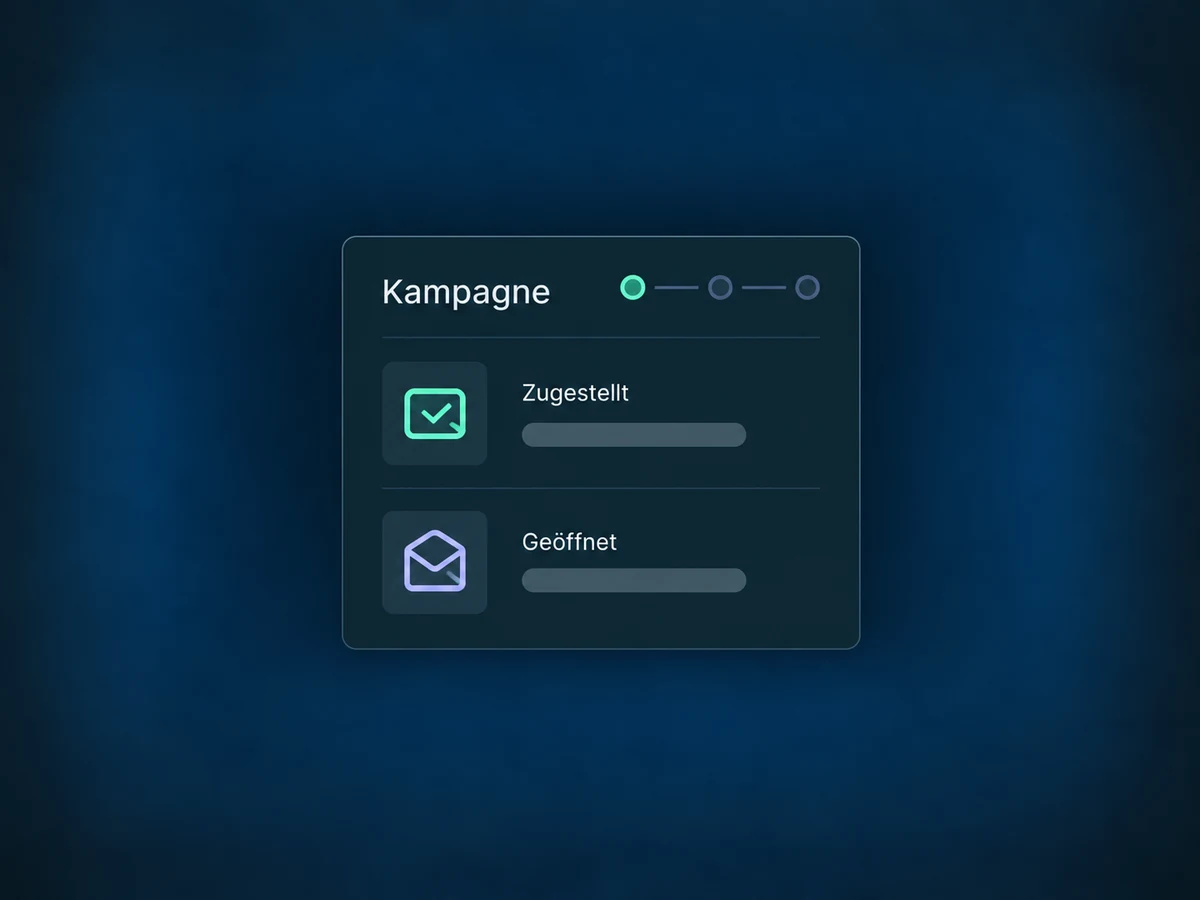
Show delivered and opened emails for a selected campaign. Keeping those metrics separate makes it clear: delivery is not an open.
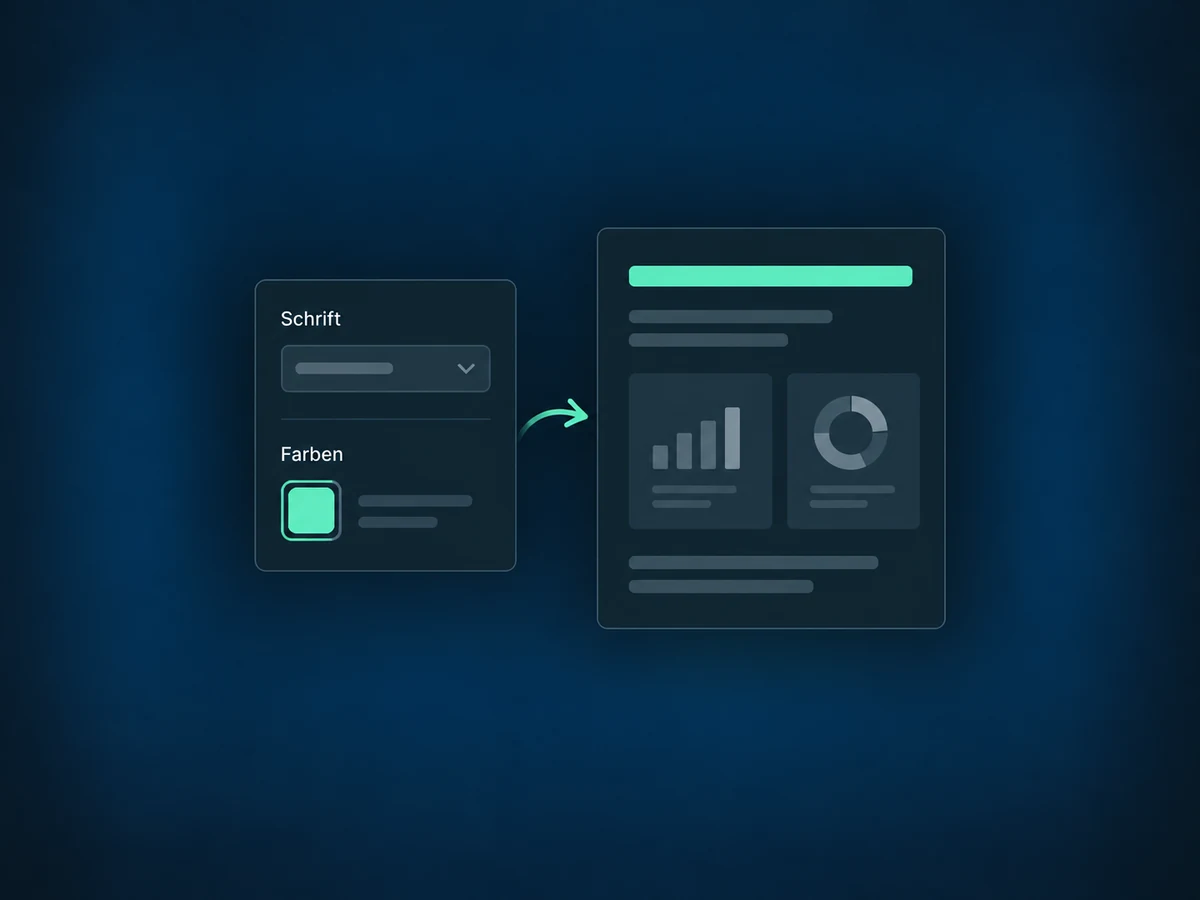
Adjust fonts, colours and page layout. Give clients a coherent document instead of a collection of screenshots.
Download a PDF for the meeting. Check it before sharing: images and embedded web pages are excluded, and tables have limits.
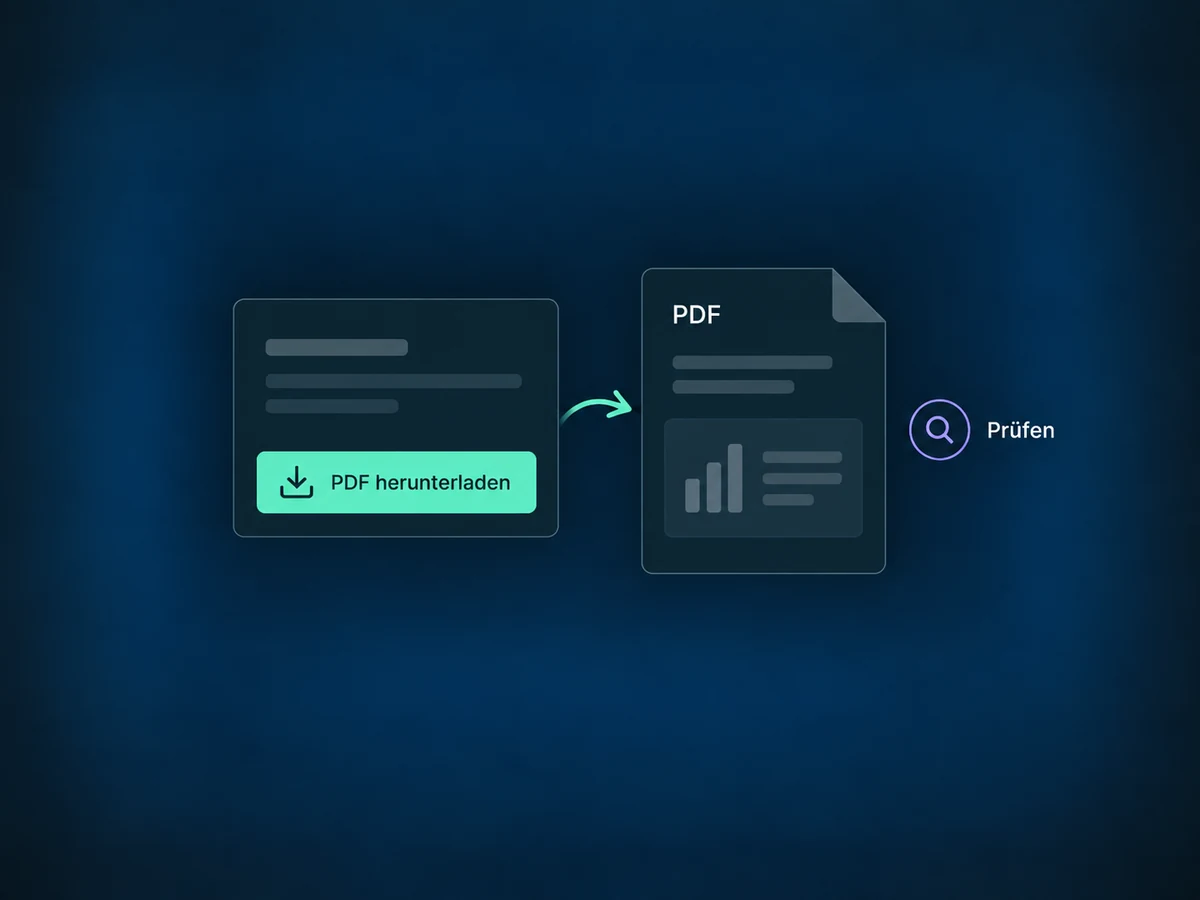
Simplified examples, not live account data.
During setup, we check available metrics, date fields, feature access and data permissions. Then we agree recipients, frequency and time zones. A test checks that the output matches the intended report.
The dashboard remains your working view. A delivered report captures the data when it is generated; later changes do not update that email.
Availability and any add-on or usage costs are confirmed for your ONE LOOP account before implementation.
Recipients do not need a login for the emailed report. A linked dashboard still requires the right login and permissions. Review the data and its recipients before sharing.
Tables show only the first 100 records, with no drill-down views. PDFs also exclude images and embedded web pages. Complete data and deeper analysis require an authorised view in the system.
No. In scheduled reports, the logged-in user contact metric uses the report owner, not the email recipient. For individual reporting, configure suitable filters and separate reports.
Check the period and time zones: the editor uses your browser’s time zone, while the scheduled email preview uses the account’s. Connected ad accounts can use their own. Individual widget date settings may also differ from the report period.
Let’s explore your use case and what the setup requires.
Book a demo