01
Build the overview you need.
Choose a metric and define what it counts. In this example, New contacts counts records by their creation date. You can see exactly what the number represents.

Dashboards
How many new contacts came in? Which appointments are coming up? Bring the metrics you need into one clear dashboard.
Three examples show how you can use Dashboards.
Choose a metric and define what it counts. In this example, New contacts counts records by their creation date. You can see exactly what the number represents.
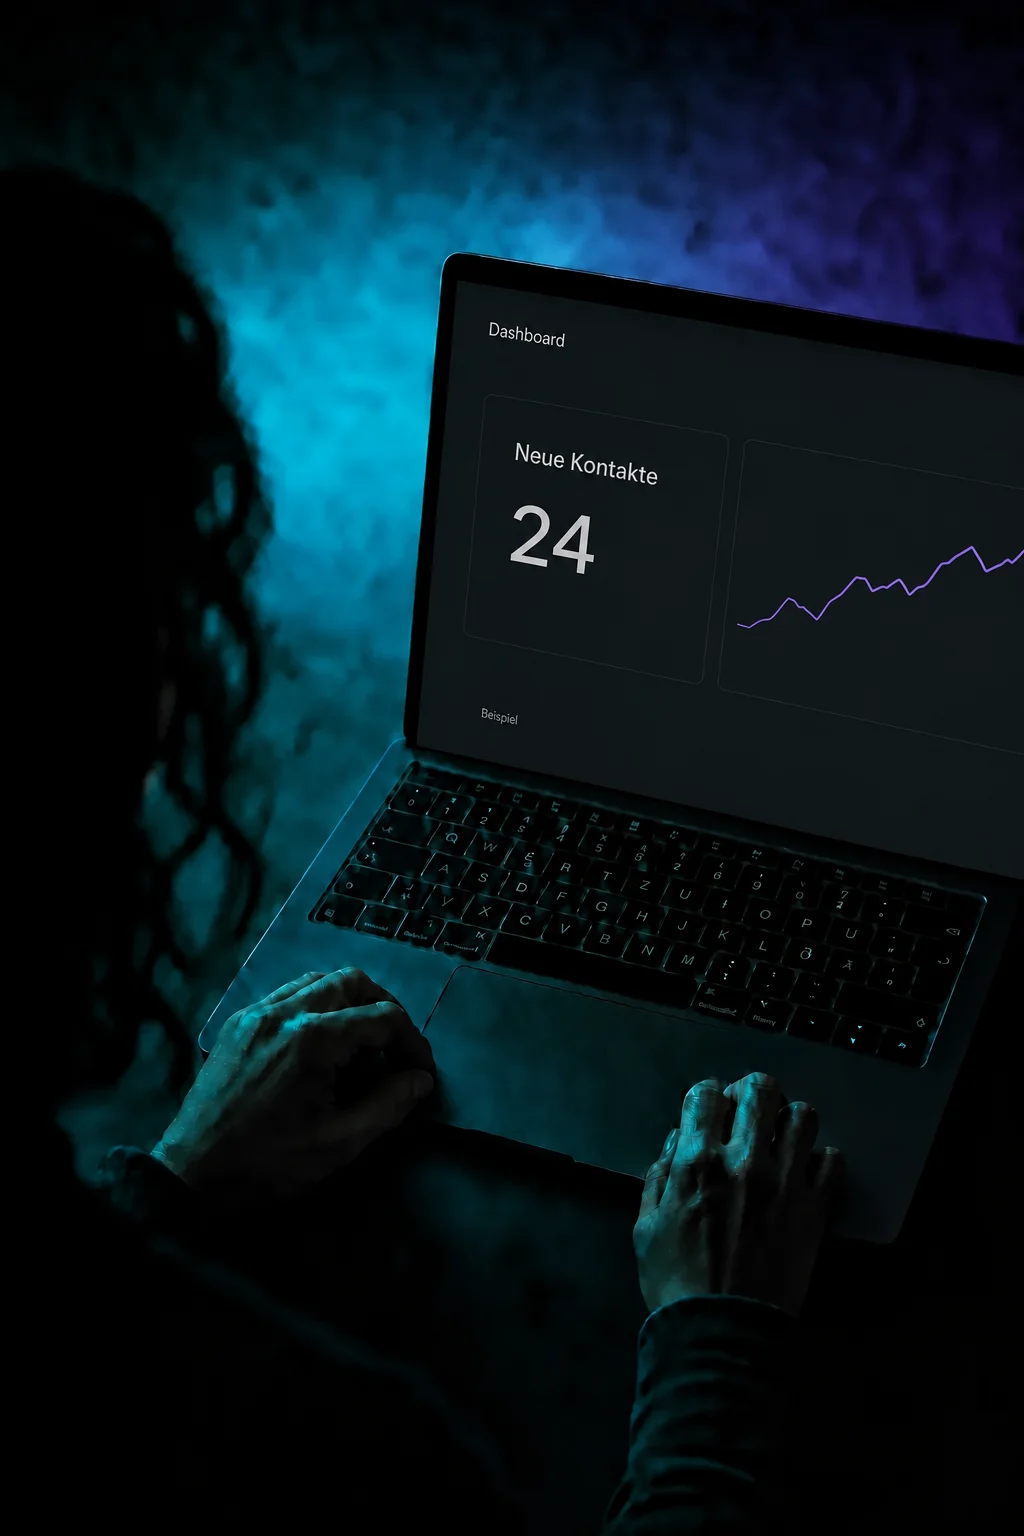
Choose a period and filter by assigned person, for example. Configured quick filters apply to custom widgets using the same data source. Your selection does not change your colleagues’ filters.

Keep a dashboard private or share it with account roles. Your team can have view access while authorised users edit the metrics. Check data access separately.

The practical benefits of Dashboards.
Create separate views for sales, appointments or contact quality. Start each review with the right question instead of a long list of every metric.
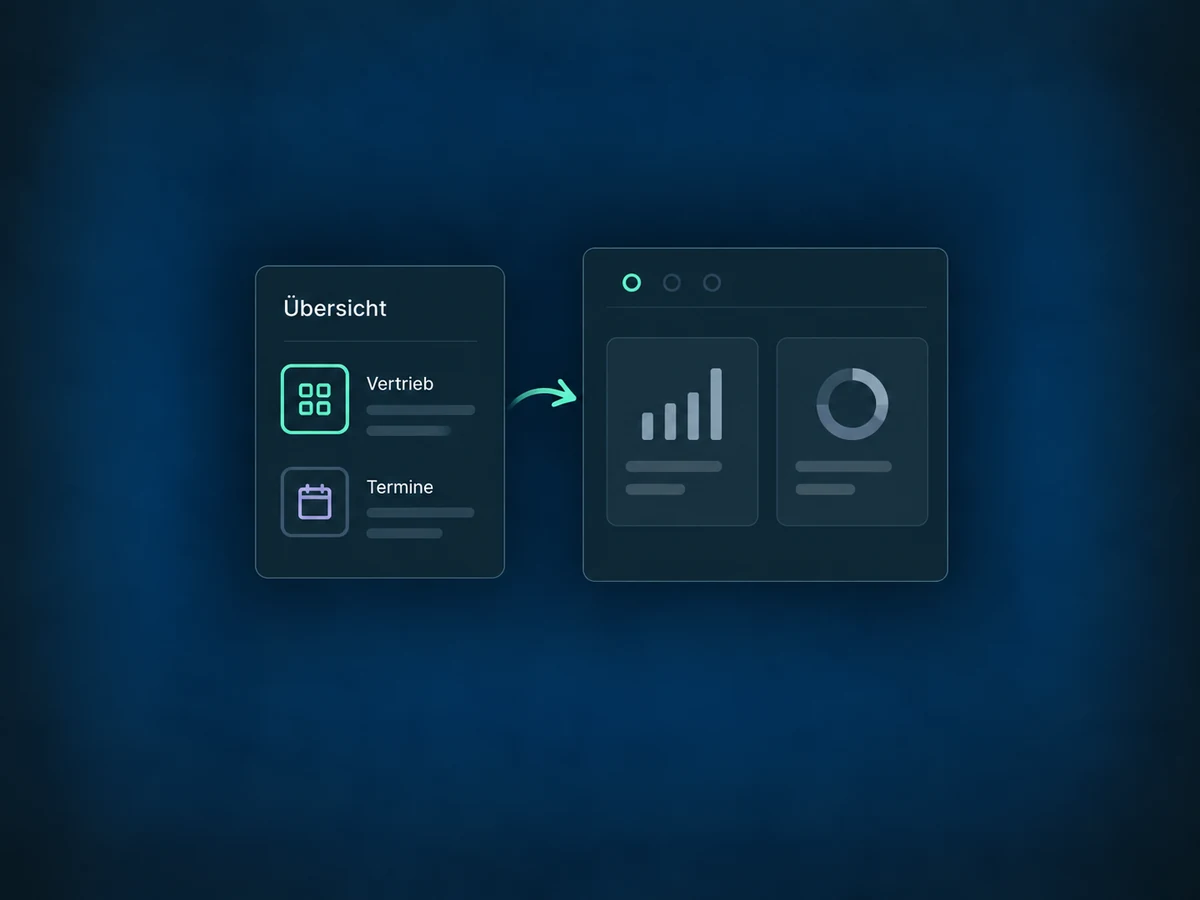
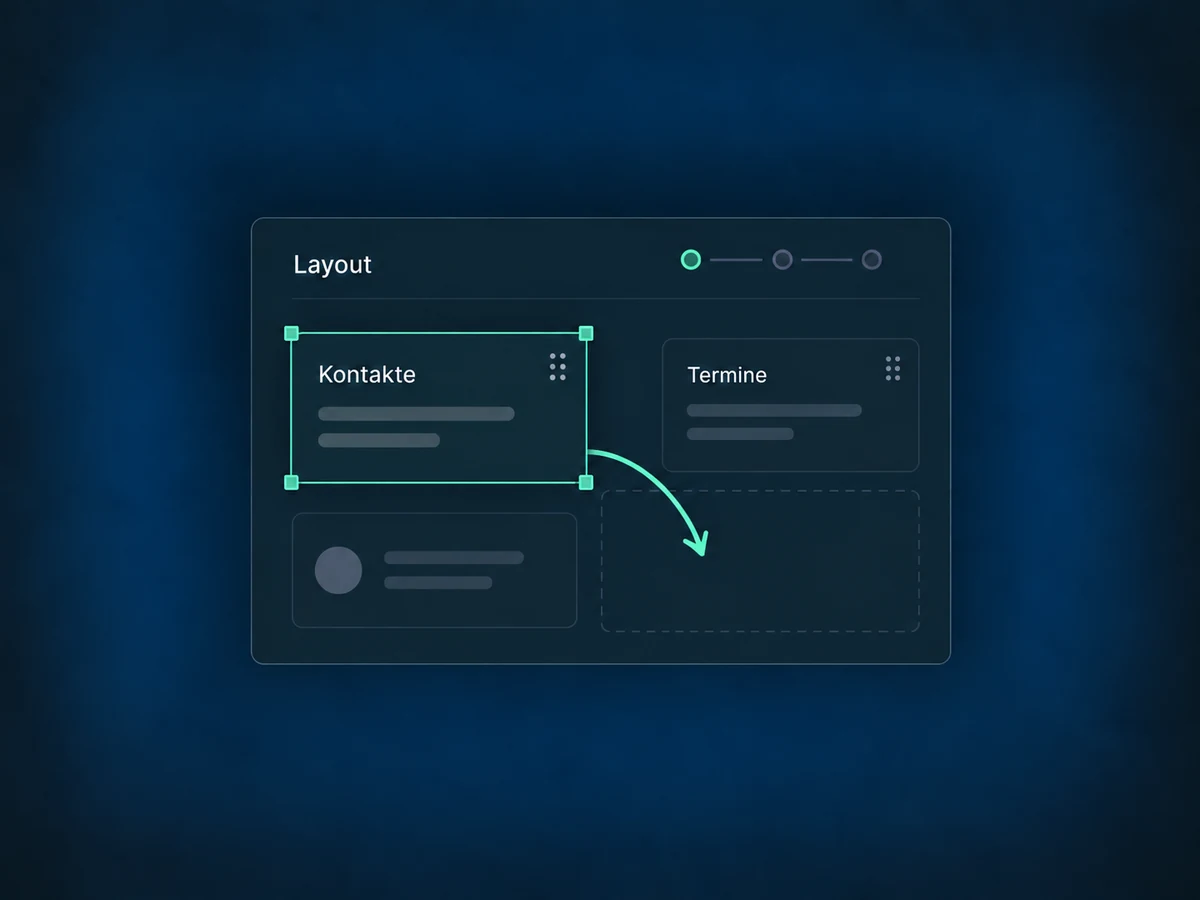
Move and resize widgets in edit mode. Give the metrics your team uses every day the space they need.
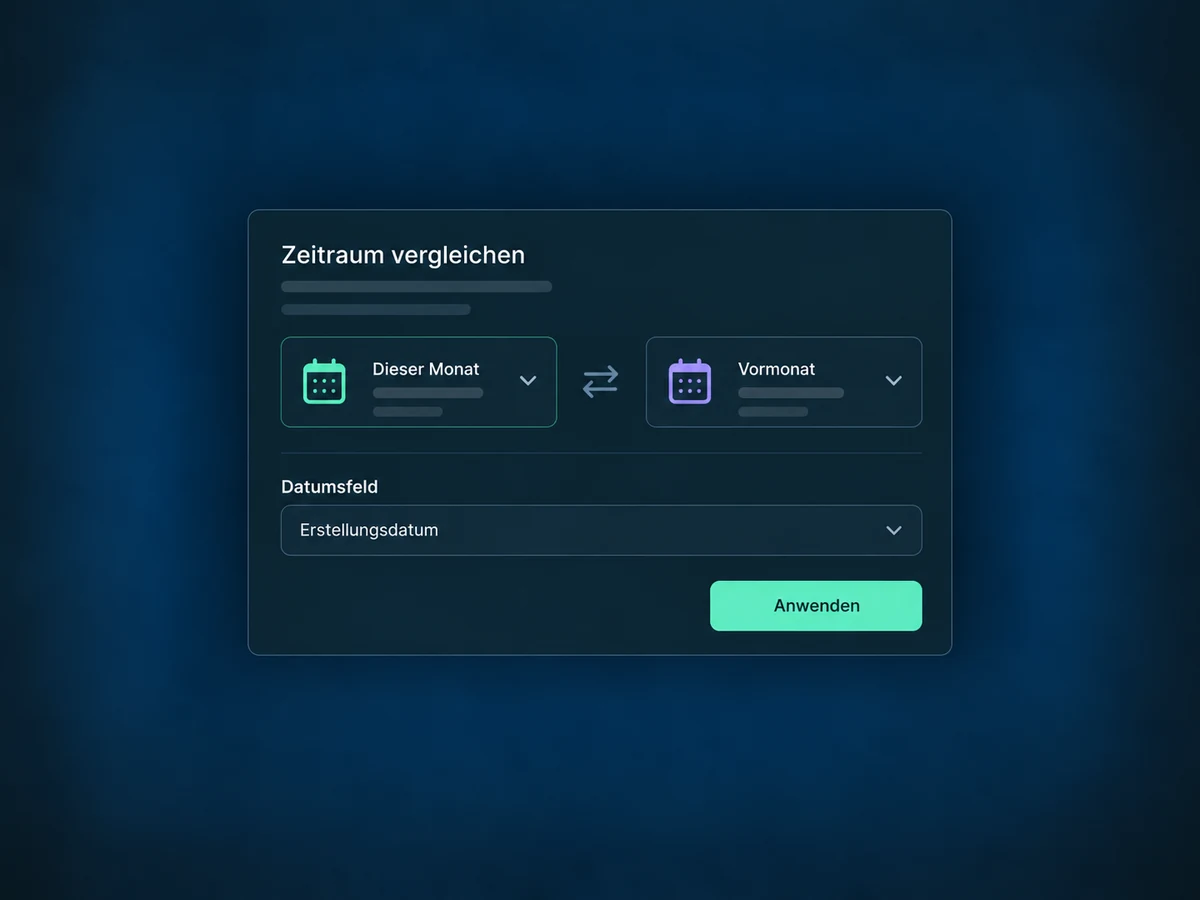
Compare suitable periods, such as this month and last month. Check the date field and any comparison settings applied to individual widgets.
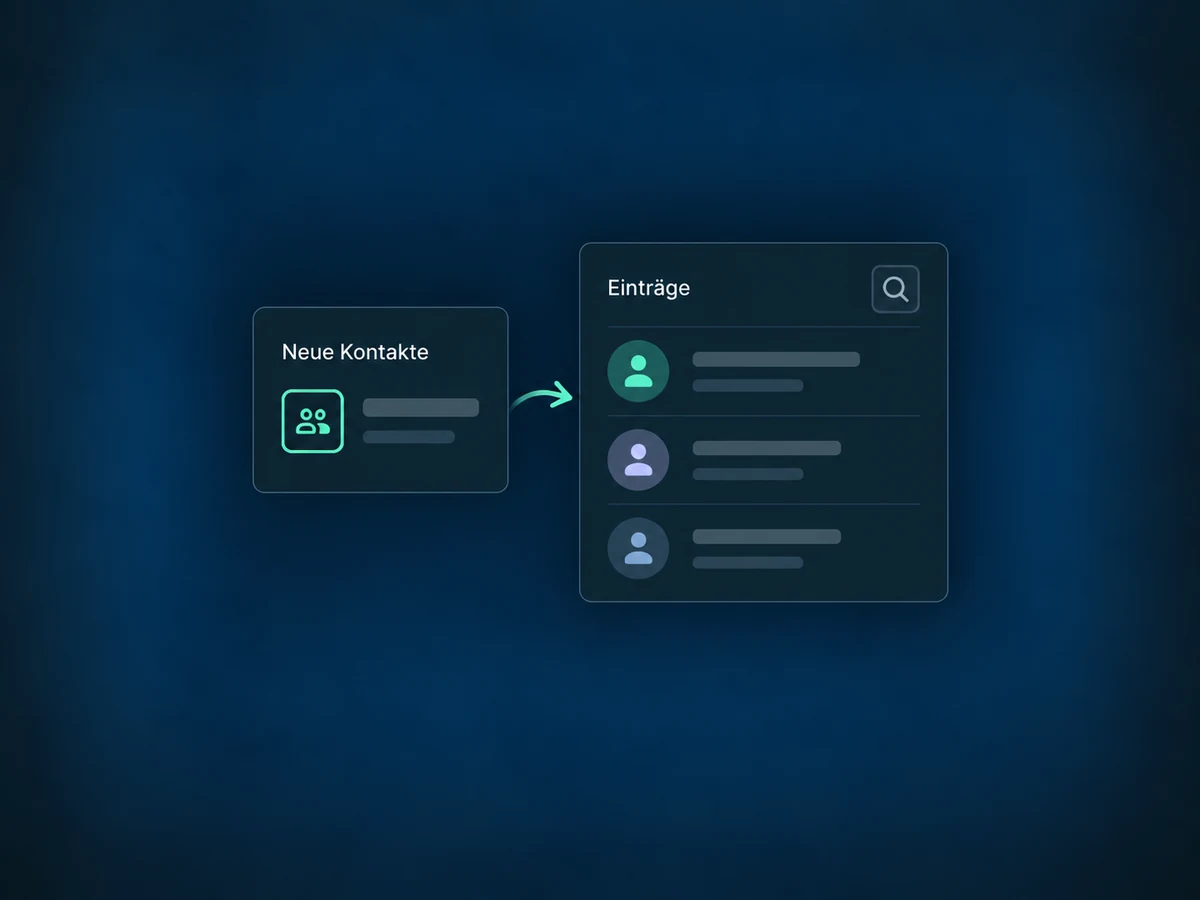
Open a metric’s detail view to inspect the underlying records. Understand an unexpected value before passing it on.
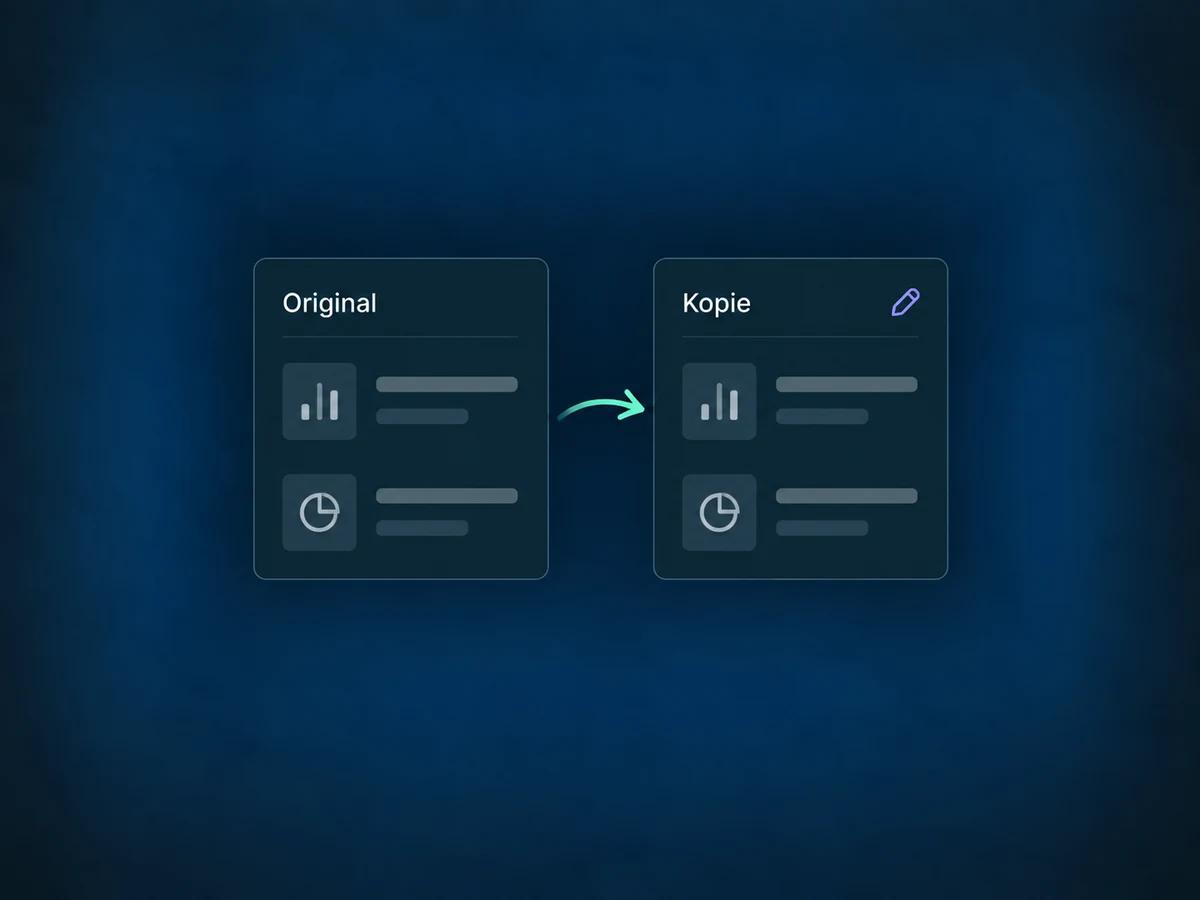
Clone an existing dashboard and adapt the copy. Review its metrics, filters and permissions for the new purpose.
Simplified examples, not live account data.
During setup, we check your account’s available widgets, date fields, filters and roles. A new contact is not automatically a qualified lead: the metric needs to match the question.
The dashboard is your working view for filtering and checking data. Scheduled delivery belongs to the separate reports feature. External data needs a supported connection; completeness and freshness depend on the source.
Availability and any add-on or usage costs are confirmed for your ONE LOOP account before implementation.
Use a dashboard to explore data with different filters and periods. A delivered report captures a snapshot for its recipients. Recurring email delivery is therefore configured separately under Reports.
Quick filters apply only to custom widgets with a matching data source, not to the default general widgets. Widget conditions still apply: a quick filter narrows the results further. Fixed periods or a different date field can also explain different values.
Yes. Account roles can have separate view and edit permissions. Viewers can use configured filters but cannot edit the layout. Dashboard sharing does not replace data permissions; both are checked before sharing.
Choose from the widgets available in your account, such as contacts, appointments and opportunities. External metrics are not all available automatically. Sources, connections and data collection determine how complete and current a view is; there is no blanket real-time guarantee.
Let’s explore your use case and what the setup requires.
Book a demo