
01
See which pages people visit.
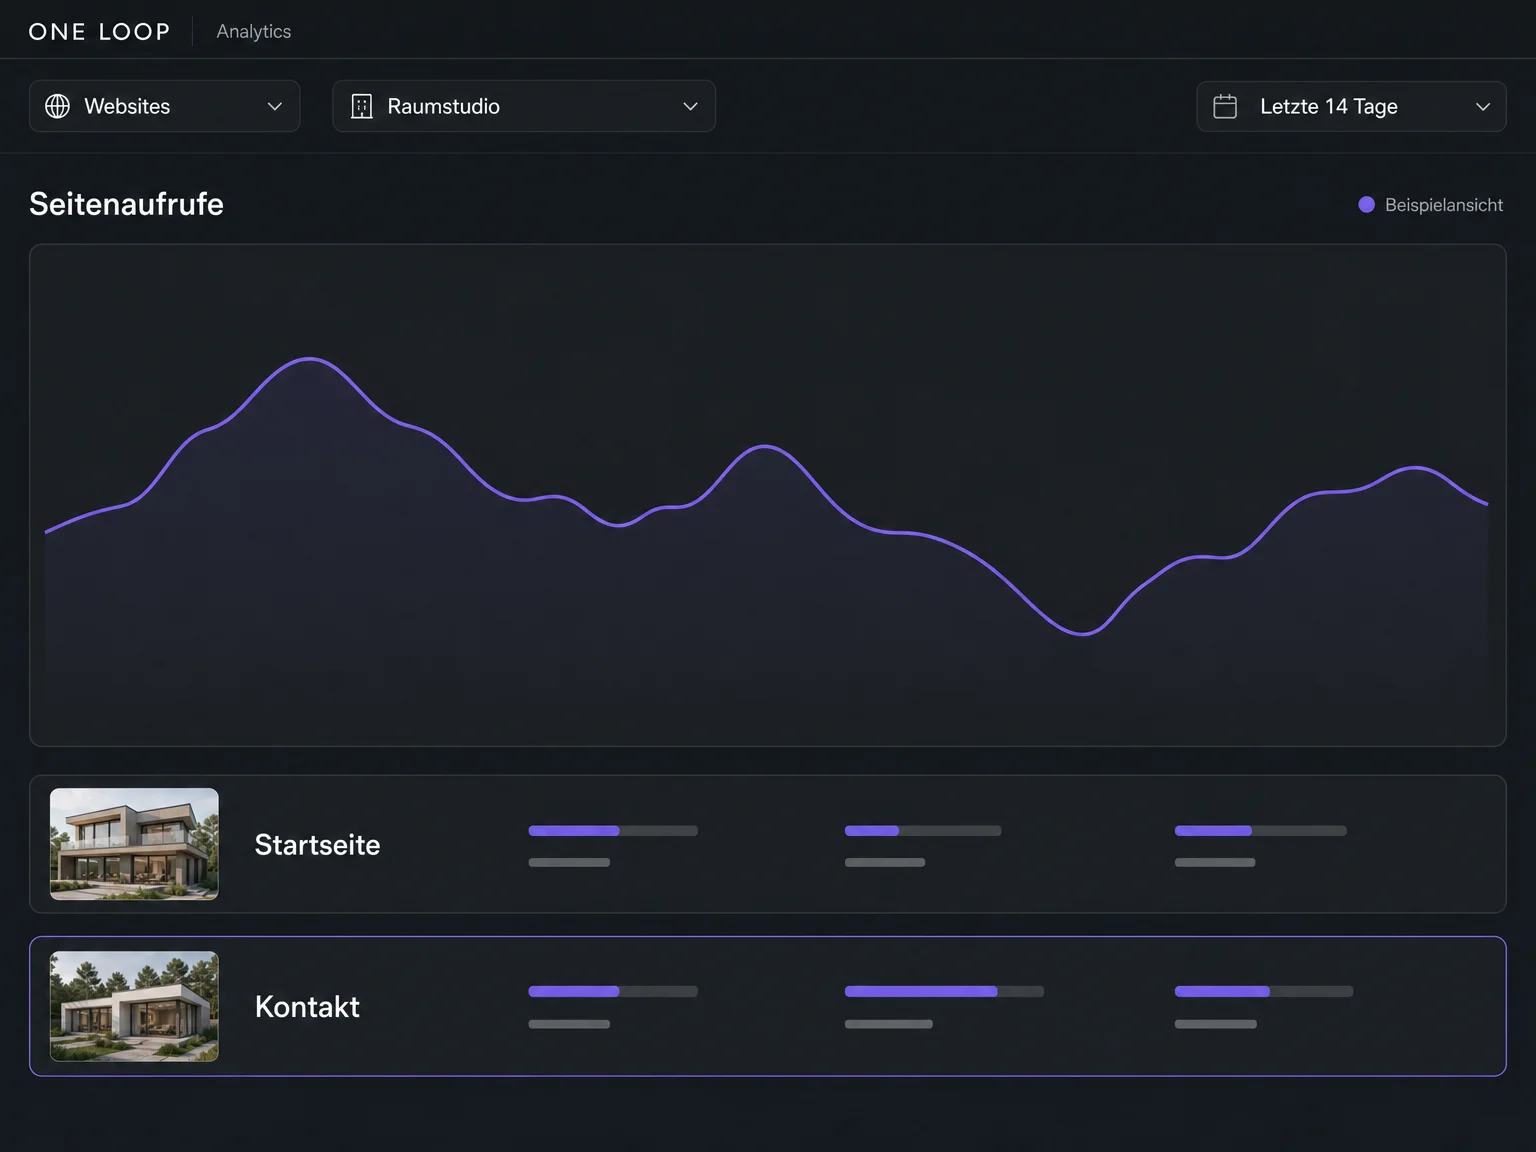
Choose a website or funnel and a date range, then open a specific page or funnel step. See where visitors arrive and which parts of your site receive less attention.

Analytics
Which pages attract visitors? Where do enquiries or purchases happen? Review your websites and funnels in ONE LOOP by page, date range and visitor segment.
Three examples show how you can use Analytics.
Choose a website or funnel and a date range, then open a specific page or funnel step. See where visitors arrive and which parts of your site receive less attention.
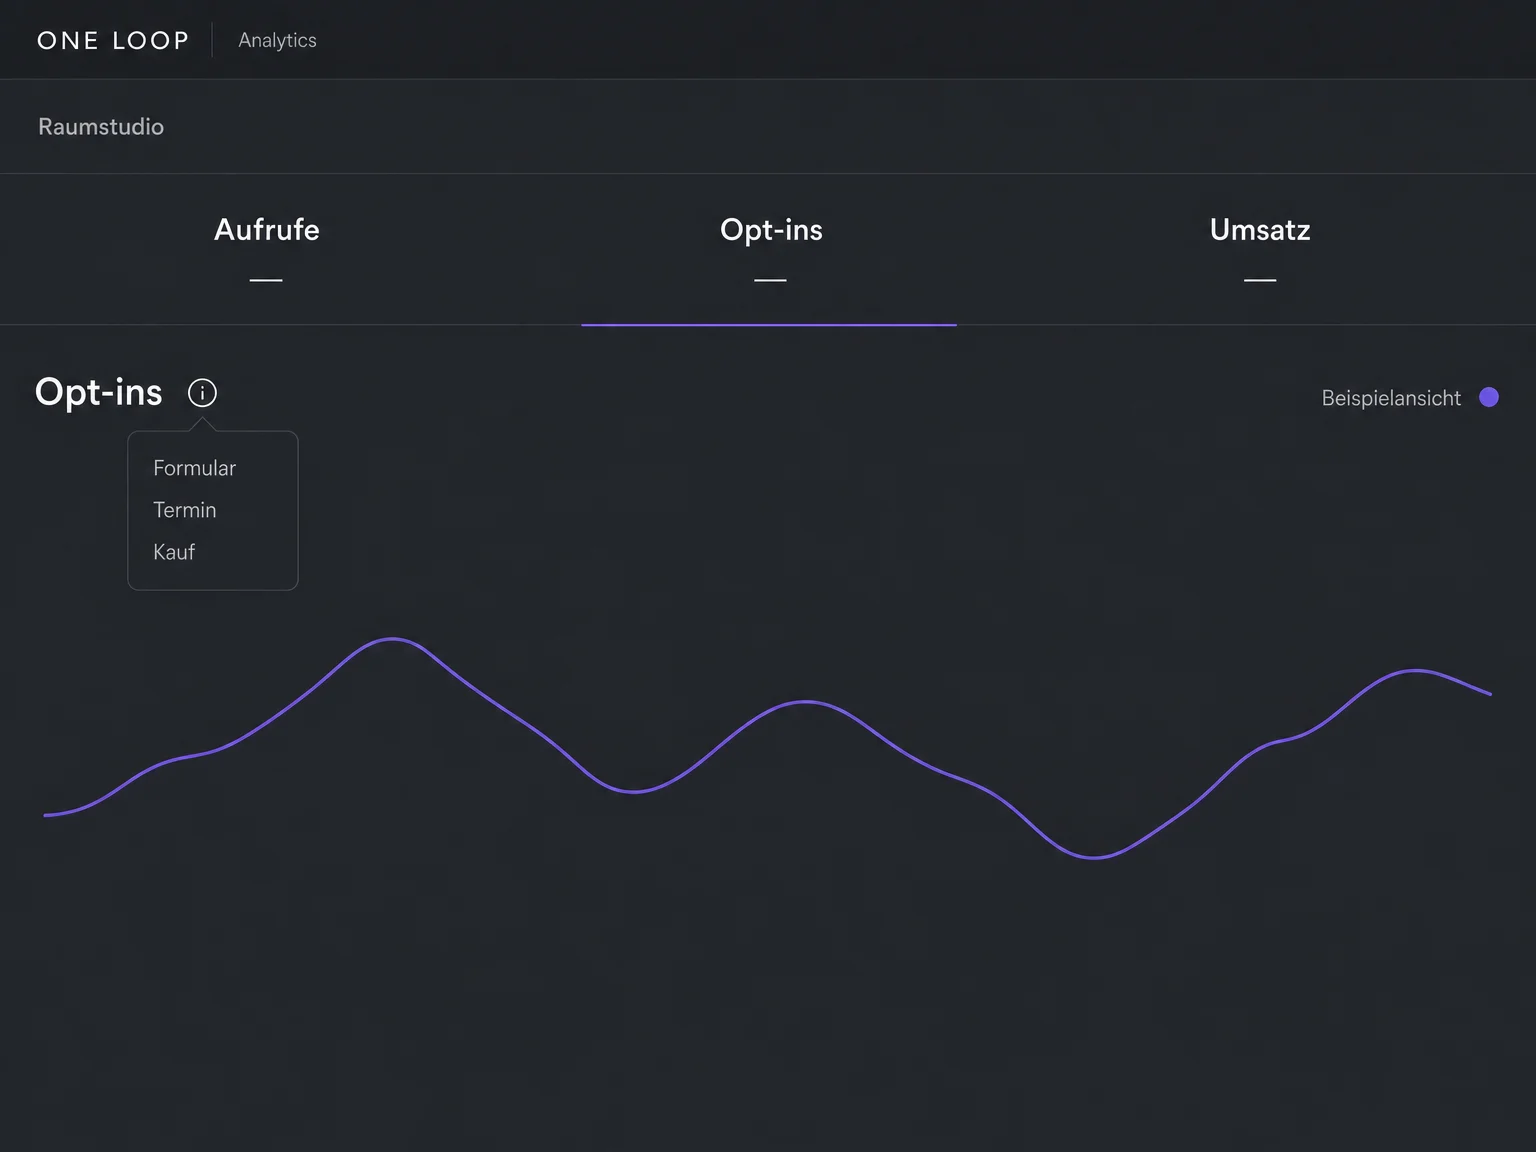
Switch between views, opt-ins and revenue. Opt-ins include recorded actions such as form submissions, bookings or purchases. The rate compares these actions with unique views; it is not simply a count of new contacts.
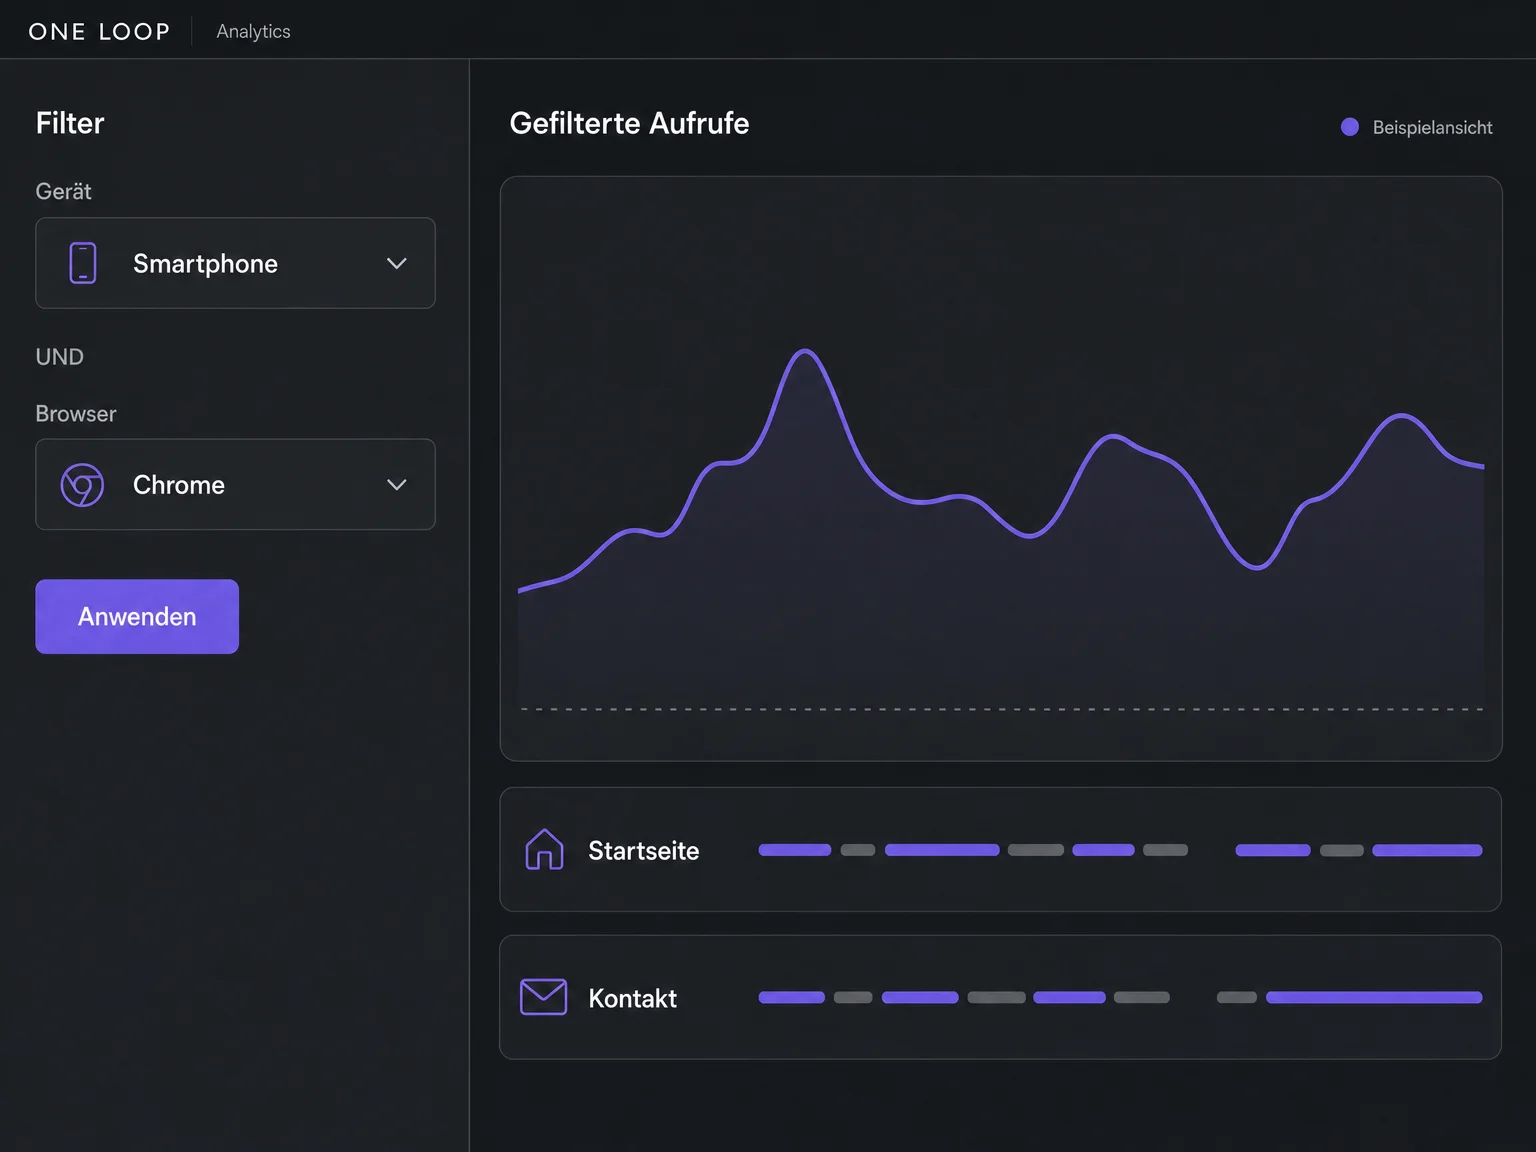
Narrow the analysis to smartphone visits in a particular browser, for example. Combine relevant filters and inspect that segment before changing content or the mobile layout.
The practical benefits of Analytics.
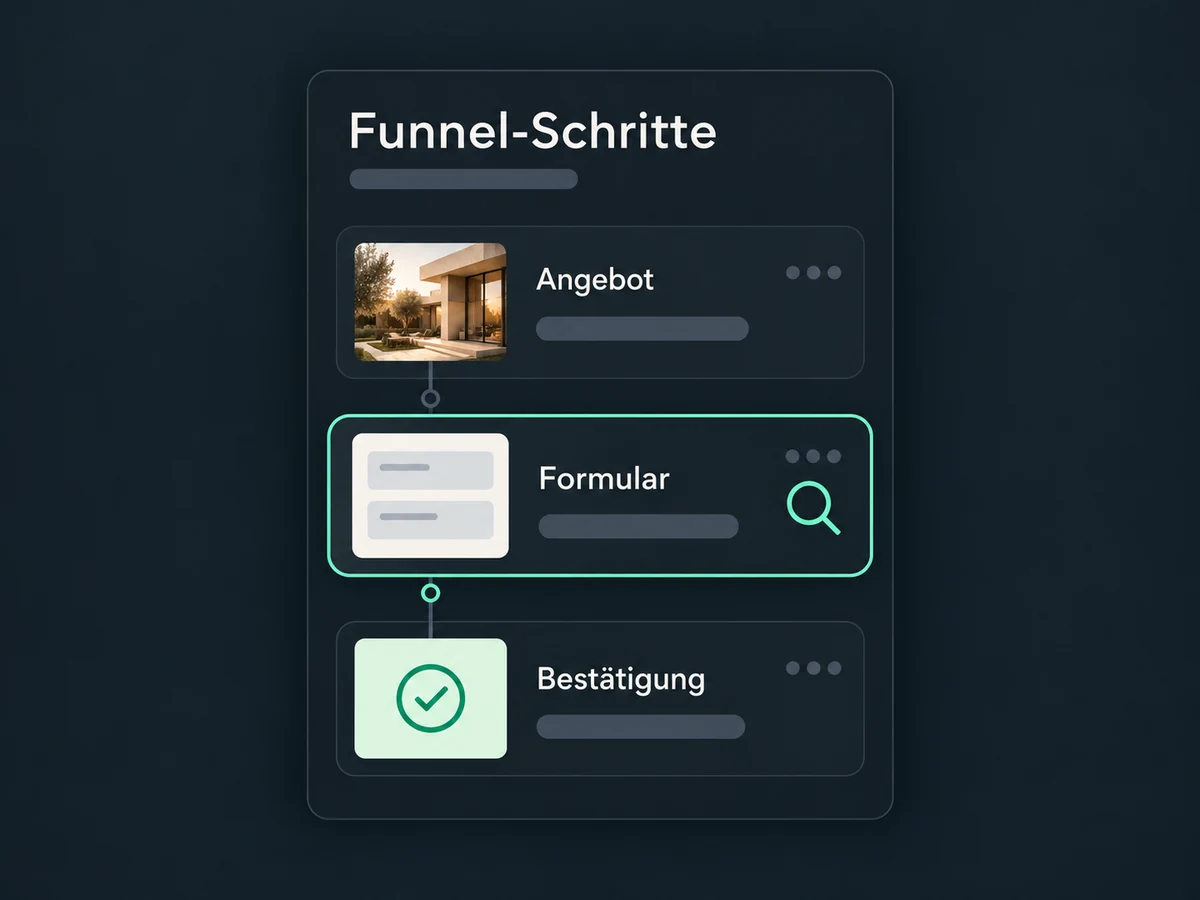
Open individual funnel steps. Review the offer, form and confirmation separately rather than relying on one overall total.
Total views include repeat visits. Compare them with unique views to understand whether more views also mean more measured visitors.

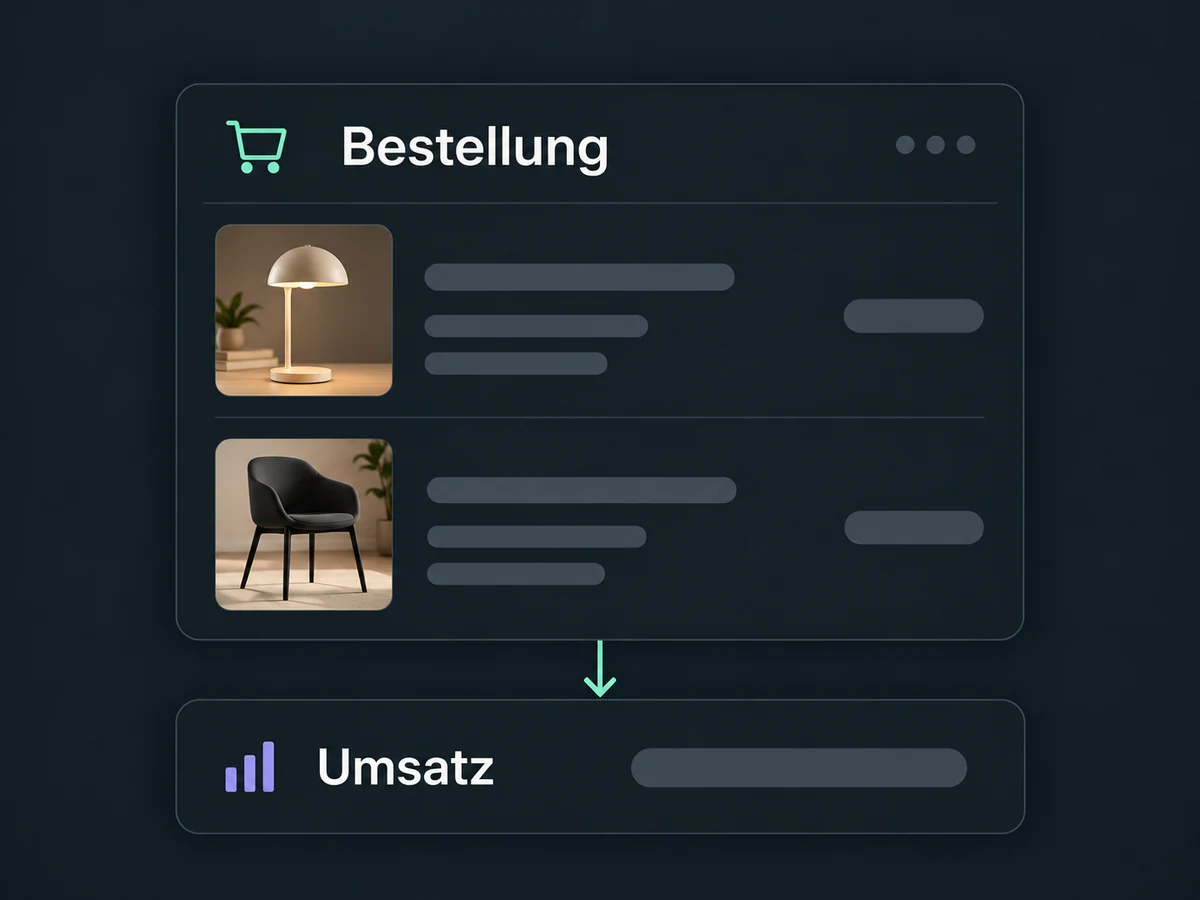
For tracked purchases, review orders and revenue. One order containing several items is not the same as several separate orders.
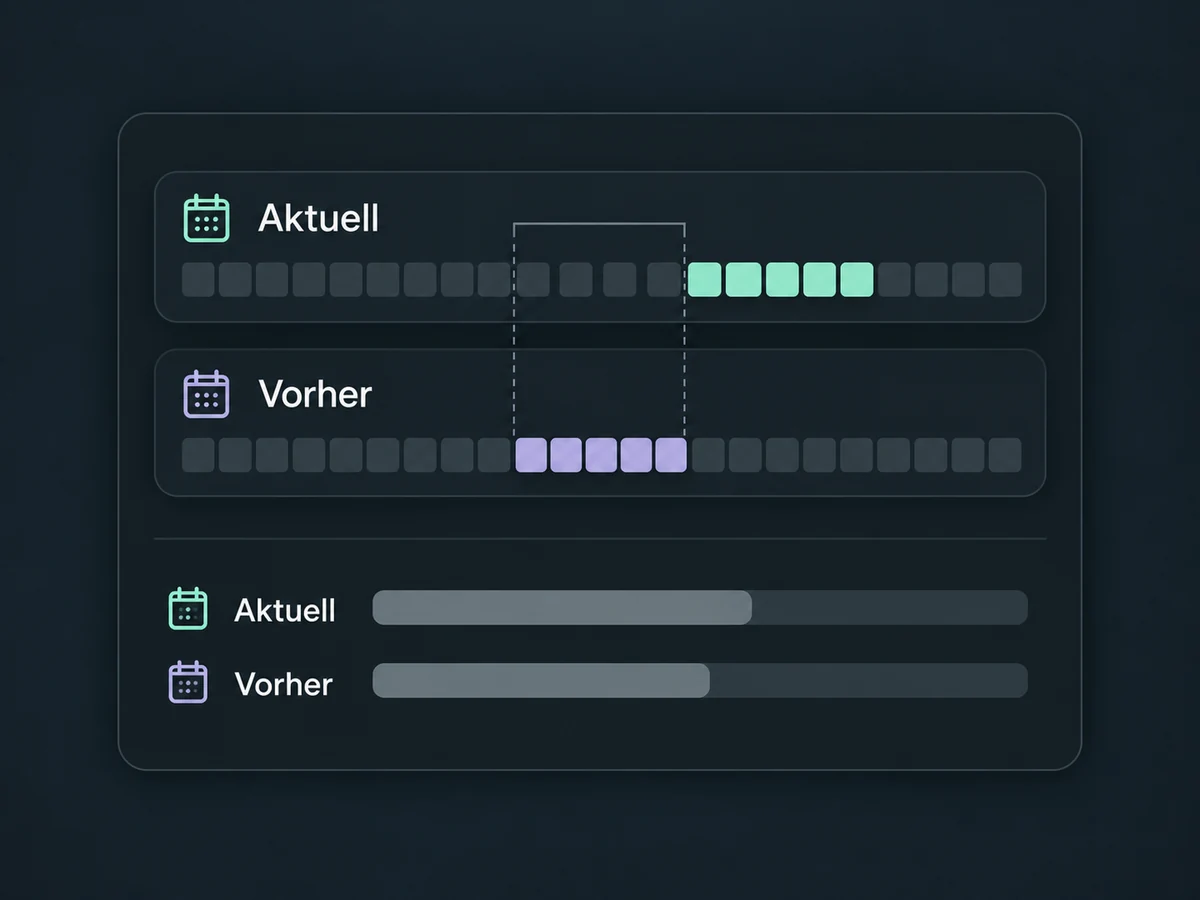
The overview compares your selected period with the immediately preceding period of the same length. Account for campaigns or seasonal effects when interpreting changes.
Filter by device and browser. Unexpected results help you decide which view to test yourself; they do not replace a functional test.
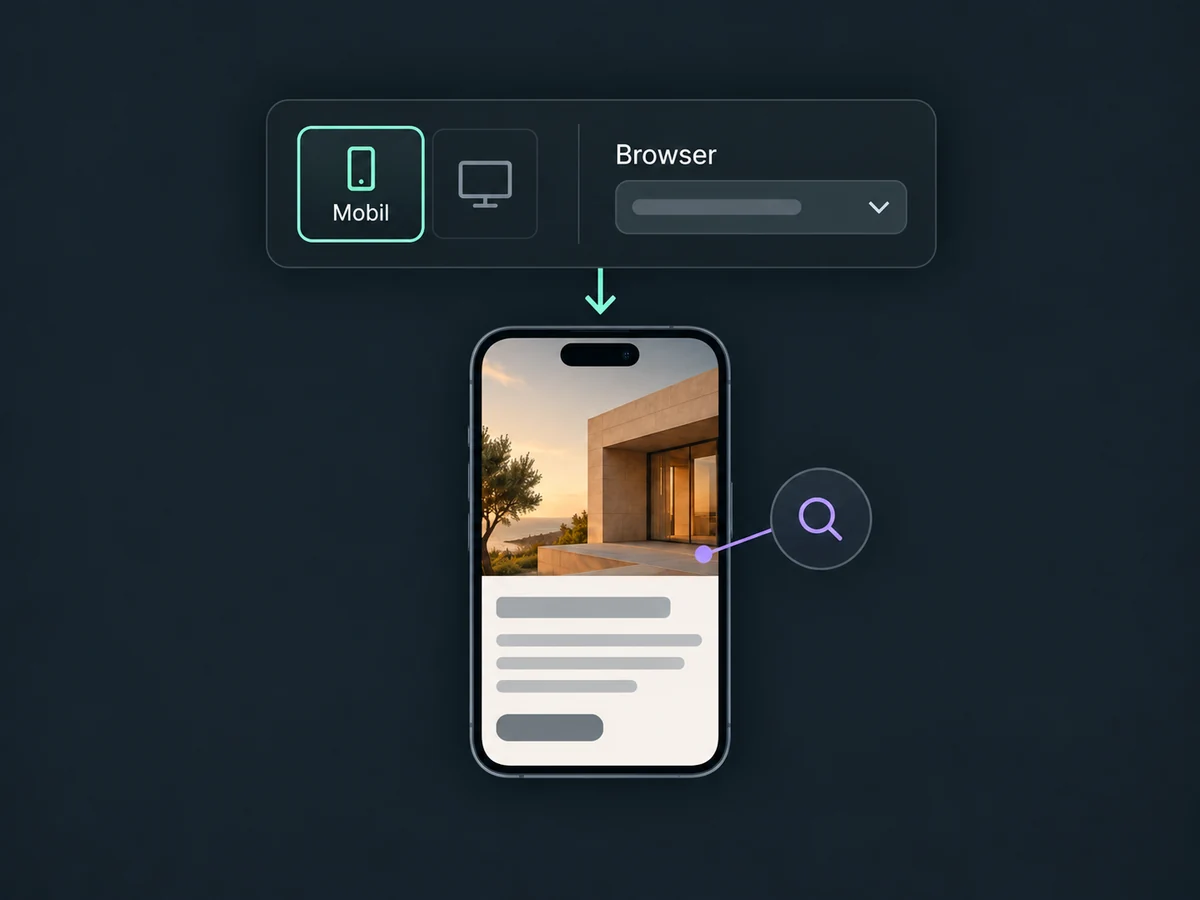
Simplified examples, not live account data.
Check published pages, recorded actions and required consent. Choose the asset type, period and metric deliberately: not every view shows the same values. Advanced filters are not retained after reloading or leaving analytics.
Analytics measures recorded page activity. Attribution explains an individual contact’s source. Dashboards combine metrics, while reports share a defined snapshot.
Availability and any add-on or usage costs are confirmed for your ONE LOOP account before implementation.
No. A page view records a visit. Depending on the asset type, opt-ins can include form or survey submissions, calendar bookings and purchases. The opt-in rate divides recorded opt-ins by unique views. It is neither a count of new leads alone nor proof of qualified enquiries.
All views include repeat visits. Unique views distinguish visitors within the available measurement. They do not guarantee recognition of every person across devices.
This page covers page statistics. Source and campaign mapping for individual contacts is covered separately under Attribution, including first and latest recorded sources.
First check the metric, date range and active filters. Time zones, consent and blocked tracking can also cause differences. Complete measurement of every visitor is not promised. An external website additionally needs the appropriate tracking setup; linking to the page is not enough.
Let’s explore your use case and what the setup requires.
Book a demo